
If your work involves dealing with sustainability and climate protection issues, you may be familiar with questions like: “Don’t we have other priorities right now? How can we align the green transformation with our economic goals? Shouldn’t these climate goals be postponed?”Given geopolitical disruptions and weak economic growth in many regions of the world, these questions seem justified. But to be clear: the estimated societal costs of climate adaptation far exceed the costs of climate protection (i.e., the transformation to net zero) in the medium to long term. (1) This also affects companies, for example, in the supply of cooling water to their sites, the interruption of supply chains due to extreme weather events, or the heat-related health effects on employees. Therefore, it is not surprising that the number of companies with voluntary commitments to climate goals continues to grow: for example, in the Science-Based Targets Initiative, 546 companies set a target in 2020, and by 2023, there were already over 7500 companies signed up. (2) Companies report on and set goals for both their direct and indirect emissions in their value chain. The use of green energy is often already competitive, and some new raw materials, produced from sustainable resources and with the help of ‘low CO2’ technologies, can become competitive through capacity scaling. This also depends on the price development of fossil raw materials and regulatory frameworks, such as subsidies or CO2 taxation. Overall, the social and political demand for green transformation will require additional investments and costs, and must therefore be economically efficient and marketable. Manufacturers of ingredients for the home and personal care industry are in a crucial but not easy position: it is the chemical companies that replace or improve emission-intensive processes, choose between fossil and sustainable raw materials, and drive the research and development of innovative production technologies with low CO2 footprints. These reduction measures by chemical companies have the potential to reduce greenhouse gas emissions (GHG) along the entire value chain: the reduction of direct emissions of the respective company is simultaneously reducing indirect emissions of other companies.
To this end, it is important to answer two strategic questions:
1) What technically feasible options for decarbonization and defossilization are available to the chemical industry?
2) How can investments in reduction measures be economically profitable? To answer this second question, it is crucial to pinpoint the value proposition (claim) that is being made to the users of the resulting products with a reduction measure. Standards for calculating and reporting GHG emissions play an important role in this matter. These standards determine the rules by which the CO2 reduction resulting from an investment by a supplier may be attributed to its products and specific customers. These rules in key standards such as the Greenhouse Gas Protocol or ISO standards for environmental management are currently being further developed in revisions. More flexible attribution rules allow companies to concentrate the CO2 reduction of their measures on the products and markets that demand it, thus accelerating the transformation.
Challenges and Strategies to Achieve Net Zero
Emissions along the Value Chain
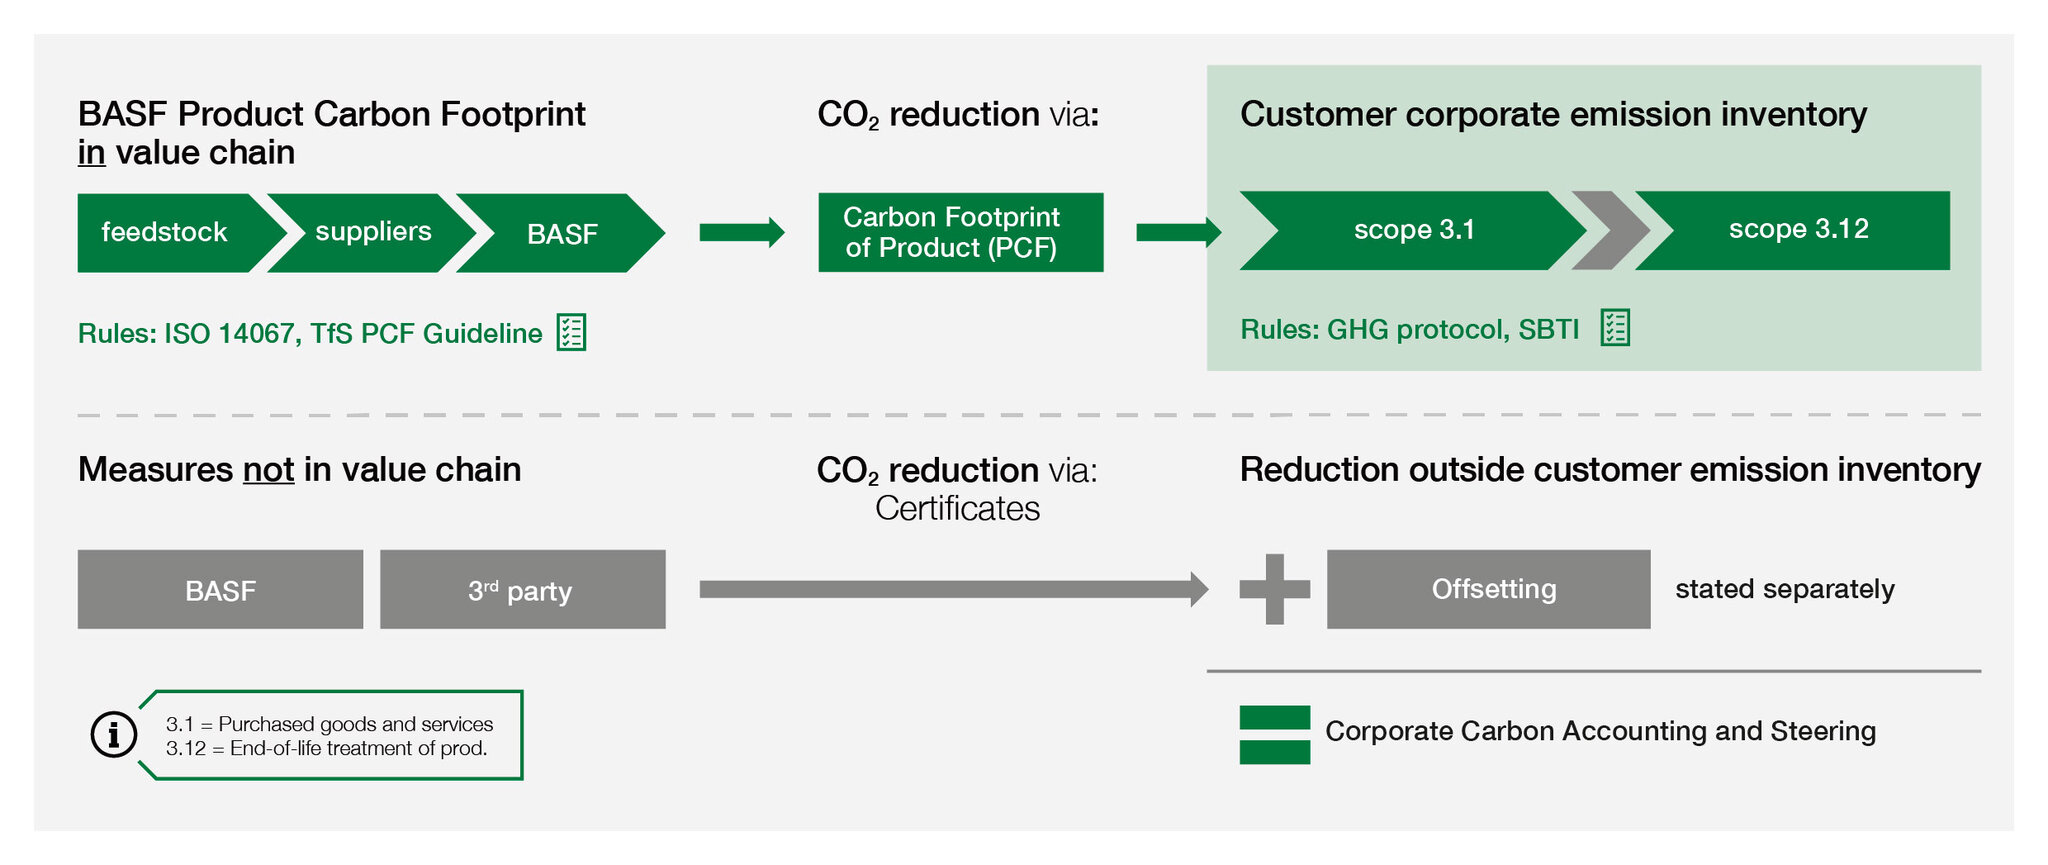
Figure 1. Connection between Carbon Footprint of Products and corporate emission accounting.
The series of standards of the Greenhouse Gas Protocol (3) is the most important guide for calculating emissions and identifying hotspots along the entire value chain. These standards divide emissions into scope 1: direct emissions under the control of the company, scope 2: indirect emissions from the generation of purchased energy, and scope 3: all other indirect emissions occurring in the company’s value chain, both upstream and downstream. Of particular interest, due to their significant contribution to the value chain are the subcategories scope 3.1: upstream emissions from purchased goods and services, scope 3.12: downstream end-of-life treatment of sold products, and scope 3.11: downstream use of sold products.From the perspective of almost all companies, but especially brand owners, the largest share of their value chain emissions are scope 3 emissions. For instance, all emissions, from resource extraction to the production of purchased goods, fall under scope 3.1. This includes energy and process-related emissions of all suppliers and tiers along the value chain. Despite BASF’s high- backward integration, the contribution of energy and process-related BASF emissions to the cradle-to-gate carbon footprint of products (PCF) (4) of its home and personal care ingredients is usually only between 5% and 30%. Hence, companies face the challenge of making the emissions of all tiers along the supply chain transparent and reducing them. The preferred approach for this is the transmission of the specific cradle-to-gate PCF by the supplier for the raw materials purchased from them. The more suppliers determine and pass on the PCFs of their products based on their production data over time, the higher the share of ‘real’, i.e., primary data in scope 3.1 (as opposed to ‘generic’, i.e., averaged data from literature or databases). A milestone in this regard was the publication of the Together-for-Sustainability (TfS) guideline of the chemical industry, (5) which contains detailed instructions and rules for calculating emission factors for the chemical sector to make the PCFs of different companies comparable. Only the use of company-specific PCFs, which are regularly updated, allows tracking progress through reduction measures by suppliers under scope 3.1. In addition to the chemical sector-specific TfS guideline, the cross-sector initiative Partnership for Carbon Transparency (PACT) (6) is important, which also issues guidelines and technical specifications for software to efficiently exchange PCF data between companies in a uniform format.
Emissions under 3.12 downstream end-of-life treatment of sold products in the HPC industry mainly concern the degradation of ingredients in wastewater treatment plants and the disposal of packaging. Carbon that is structurally bound is released as CO2 emissions into the atmosphere during wastewater treatment and incineration. (7) Only fossil emissions are reported under scope 3.12. Biogenic CO2 emissions are reported purely for information purpose outside the scopes, and do not contribute to the corporate carbon footprint according to the GHG Protocol. The reason for this is that biogenic CO2 would have recently been absorbed and bound by plants from the atmosphere. (8) When this CO2 is released back into the atmosphere as an emission, the atmospheric CO2 concentration does not increase beyond the previously existing level. According to our calculations of ingredient PCFs, the end-of-life (EoL) CO2 emissions from structural carbon are often almost as high as the cradle-to-gate emissions. (9) For example, comparing the cradle-to-gate PCF of non-ionic surfactants with the CO2 end-of-life, this corresponds to a ratio of 55:45.
Finally, let’s look at emissions under scope 3.11: downstream use of sold products application phase. For the HPC value chain, the main influencing factor here is the energy consumption for heating water in personal care, washing, and cleaning. This is potentially a very large contribution depending on the behavior of consumers/end-users. For this reason, reporting indirect use phase emissions is currently optional reported according to the GHG Protocol..
Reduction Measures (10)
Reduction of Energy and Process-Related Emissions: Supply contracts for green electricity offer a short-term and cost-effective way to reduce emissions, but usually contribute less to the cradle-to-gate PCF reduction of ingredients. The purchase is made in the form of certificates or guarantees of origin. These are important to ensure that when the certificate is purchased, renewable energy is actually produced accordingly and fed into the grid, thereby supporting the company’s sustainability goals. The share of green electricity at BASF is currently 26% globally (2024). (13) The generation of green process heat through the electrification of processes and the generation of green steam using heat pumps or e-boilers are to be realized in the medium to long term, as they require investment. Direct CO2 emissions from energy and chemical plants can be captured with investments in carbon capture technology. The CO2 is either stored in underground reservoirs (carbon capture and sequestration, CCS) or can be converted with hydrogen back into valuable chemicals such as methanol resulting in e-methanol (carbon capture and utilization, CCU). These processes are particularly advantageous for CO2 point sources with high CO2 content in the exhaust stream, such as power plants or in ethylene oxide production. The TfS guideline contains methodological instructions for calculating PCFs of products manufactured using green electricity and CCS/CCU.
Reduction of Feedstock-Related EoL Emissions: Since biogenic CO2 emissions are climate-neutral, the use of bio-based raw materials is a central strategy to avoid fossil emissions. New processes that use non-fossil carbon enable a reduction of fossil end-of-life emissions under scope 3.12 by substituting the use of fossil resources. This is referred to as defossilization as opposed to decarbonization, as carbon itself cannot be replaced in products, but the use of fossil carbon can.
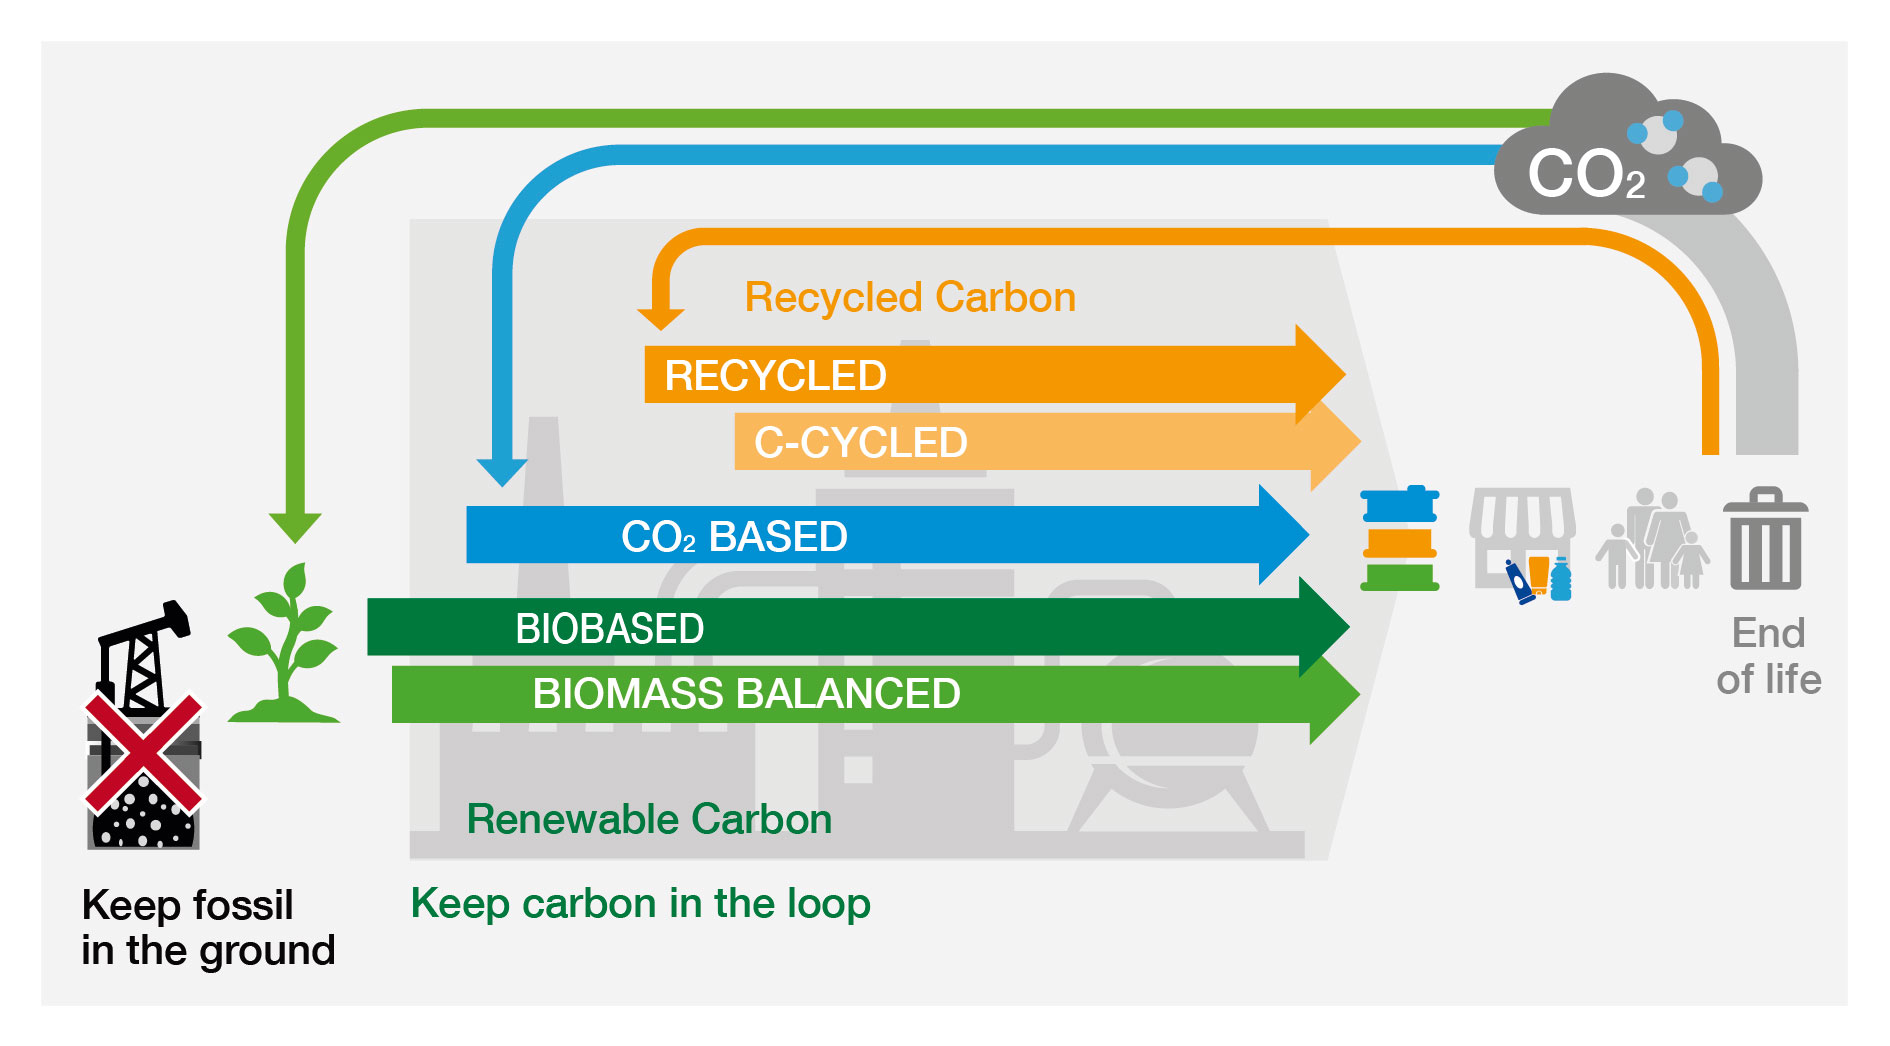
Figure 2. Renewable carbon sources replacing fossil resources.
According to scenarios for net-zero emissions by 2050, (14) biomass alone will not be sufficient to meet the chemical industry’s demand for non-fossil carbon sources. Therefore, renewable carbon in line with the circular economy must also be obtained from recycled waste and CO2 from flue gases through CCU. A certain share of fossil resources will likely continue to be used, provided that the corresponding CO2 is permanently removed through CCS.For the green transformation of raw materials, it is necessary to integrate high-volume renewable raw materials into chemical value chains. For example, bio-naphtha, biomethane, and e-methanol can be processed in petrochemical plants just like their fossil counterparts as drop-ins. However, improved conversion technologies are still required to produce platform chemicals of sufficient quality from the mentioned renewable sources. Examples include gasification and pyrolysis of mixed waste streams, depolymerization of recycled plastics, and fermentation of starch.
Reduction of Emissions during the Application Phase: Research and development by companies enable the saving of energy and resources in the application through innovations such as enzymes for cold washing and ingredients with higher material efficiency. This is at least as important as reducing the companies’ own emissions. Since the behavior of end consumers is crucial, targeted consumer education can have a positive effect. In the long term, it is necessary to advance the decarbonization of domestic hot water generation to sustainably reduce these emissions.
The Advantage and Disadvantage of Integrated Production
Chemical companies develop a wide portfolio of products in highly integrated plants. These products not only serve the household and personal care market, but also various industries and markets, such as packaging, automotive, and construction. These sectors have different requirements, standards, and willingness to pay for climate-friendly products. Integrated production has advantages because it saves costs and emissions: BASF estimates savings of about 5.7 million tons of CO2 annually through its production ‘Verbund’. (15) On the other hand, this means that individual reduction measures affect almost the entire product portfolio, resulting in a ‘dilution effect’. If green electricity or steam, bio-naphtha, or the raw material of an advanced supplier with a low PCF is fed into the network of a site, almost all products of this site receive an incremental reduction. However, since the product volume is very high, the effect on the PCF of individual products is only marginal. For example, BASF produces 6.1 million tons of products annually at the integrated site in Ludwigshafen (Germany). (16) Why is this a problem? An incremental reduction of the PCF is too small to be recognized as value by all customers. For reduction measures to be economically viable, the positive effects must be concentrated on products whose markets and customers have incentives to bear the additional transformation costs (costs per ton of reduced CO2).
Supply Chain Systems
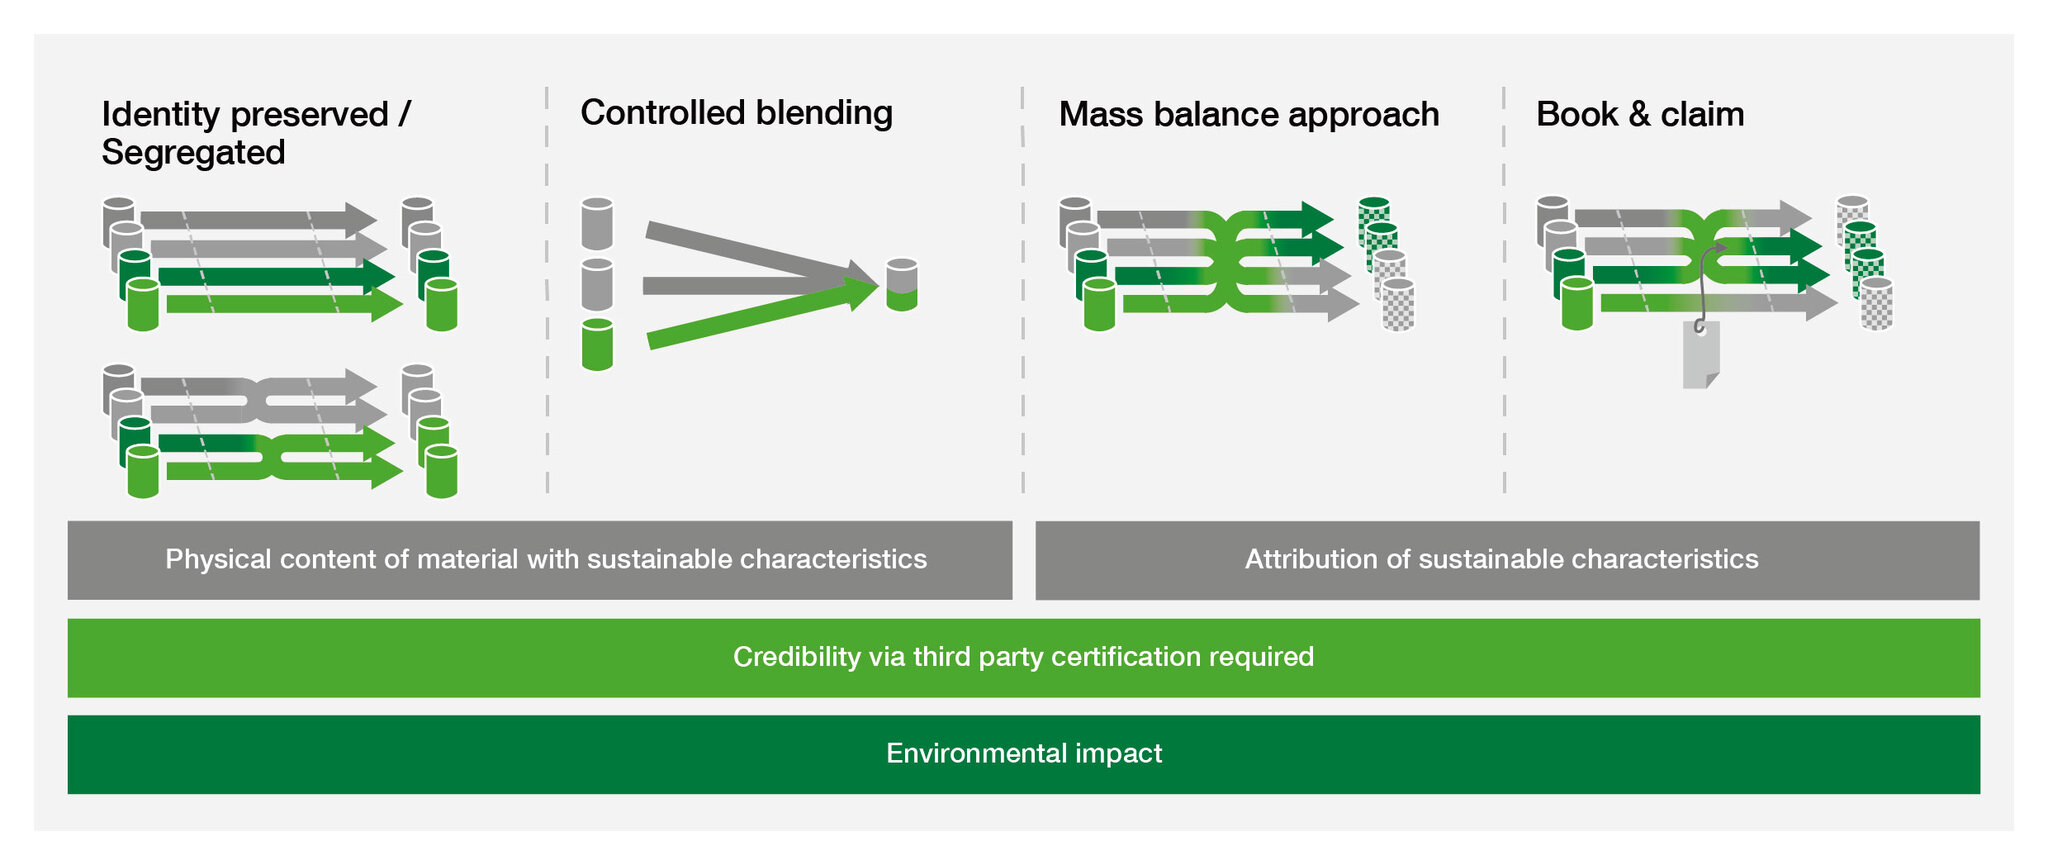
Figure 3. Chain of custody models according to ISO 22095.
A solution for concentrating sustainability attributes is the Chain-of-Custody (CoC) mass balance. ISO 22095:2020 is a global and horizontal standard that describes the requirements for implementing CoC models. CoC models offer different levels of traceability and transparency of the flow of raw materials in the supply chain, and differ in the physical presence of attributes in the end product. Mass balance is a model in which materials or energies with gray (fossil) and green (sustainable) attributes are mixed according to certain criteria. This takes place in integrated production, during transport in pipelines, or storage in tanks. Mass balance encompasses several methods, each applicable to particular production processes. In the so-called credit-based mass balance with non-proportional attribution, sustainability attributes of energy and raw material inputs are assigned to defined products (outputs), in other words, they are flexibly attributed. The ratio of gray to green attributes averaged over all inputs is identical to that averaged over all outputs, but is typically different for individual products. A certification system with third-party verification is used to independently confirm the correct accounting of green attributes, exclude double counting, and correctly calculate process losses.The credit mass balance works according to the following logic: For a certain part of the product portfolio, the customer wishes to substitute fossil raw materials with sustainable alternatives. The amount of fossil raw materials used for a specific product volume is calculated, and this amount is then substituted at the beginning of the production chain. To make this substitution, which is paid for by the respective customer, accessible to the customer, the attribution must be made to the specific sales products. Otherwise, the dilution effect would apply, and the effect could not be made accessible at customer level. Alternative mass balance models that refer to averaged values (such as the so-called “rolling average”) are neither suitable for broadly integrated production systems nor for raw materials with limited availability.
The RSPO MB system for sustainably produced palm (kernel) oil and the mass balance in biofuel markets have been in use for a long time. The mass balance CoC for bio-attributed products from renewable raw materials is now also widely used in the chemical industry. (17), (18) Recently, a certification system was established that combines the shares of ‘renewable’ materials from various CoC systems and presents them in a label for end consumers. (19)
The CoC model Book and Claim (B&C) is an option to share sustainability attributes between companies without the need to physically transport energy or materials. B&C systems are the most commonly applied method for tracking green energy, as Energy Attribute Certificates (EAC), such as guarantees of origin (GoOs), can be transferred and traded separately from the physical energy flow.
The TfS guideline contains instructions for calculating PCFs with mass balance for raw materials, and takes into consideration green electricity certificates. The developing standard ISO/WD 14077 (20) defines guidelines and requirements for methods to include various CoC in life cycle assessment (LCA).
Mass-balanced products can thus significantly contribute to reducing CO2 emissions, for example, when renewable/bio-based raw materials are used. Their physical and chemical properties remain unchanged, making them ideal ‘drop-in’ solutions. Production takes place in existing integrated plants, ensuring optimal costs for CO2 avoidance.
Conclusion and Outlook
Superficially, the indirect (scope 3) emissions in a company’s value chain may be expected to decrease on their own if all suppliers pursue their own transformation goals. However, there are two reasons why this effect does not occur in the medium term:1) Suppliers achieve their own medium-term goals through measures in plants and value chains that are not in the value chain of the other company. For example, BASF has reduced its scope 1 and 2 emissions by 22% since 2018, largely achieving its 2030 target of -25%. However, this does not affect all products to the same extent.
2) Suppliers achieve slower progress in reduction than the company itself requires according to its scope 3 reduction goals. From practical experience, many suppliers in the chemical industry are still on a learning curve to determine their PCFs and develop suitable reduction measures.
The development of capacities for green energy and renewable raw materials for the green transformation to Net Zero can therefore benefit greatly if companies concentrate CO2 reduction through a mass balance CoC model on customers and markets where economic incentives or regulation exist.
Standards for calculating PCFs and corporate carbon accounting set the rules for the flexibility allowed in attributing green attributes. We advocate for the openness of industry standards/regulations to market-based instruments such as the mass balance CoC in current revisions. By anchoring clear rules that are widely accepted by suppliers and brand owners, effective reduction measures for the transformation can unfold their potential more quickly.
- Kotz M, Levermann A, Wenz L. The economic commitment of climate change. Nature 2024; 628(8008):551–7.
- Science Based Targets Initiative. SBTi Climate Target Dashboard: Science Based Targets Initiative; 2025 [cited 2025 Apr 15]. Available from: URL: https://sciencebasedtargets.org/target-dashboard.
- World Resources Institute (WRI), World Business Council for Sustainable Development. The Greenhouse Gas Protocol: A Corporate Accounting and Reporting Standard: World Resources Institute; World Business Council for Sustainable Development; 2004 [cited 2025 Apr 15]. Available from: URL: https://ghgprotocol.org/sites/default/files/standards/ghg-protocol-revised.pdf.
- International Organization for Standardization. ISO 14067:2018: Greenhouse gases — Carbon footprint of products — Requirements and guidelines for quantification. Geneva, Switzerland: ISO; 2018. ( vol 13.020.40) 2018-08. Available from: URL: https://www.iso.org/standard/71206.html [cited 2024].
- Together for Sustainability. The Product Carbon Footprint Guideline for the Chemical Industry; 2024 2024. Available from: URL: https://www.tfs-initiative.com/app/uploads/2024/12/TfS-PCF-Guidelines-2024.pdf [cited 2025 Apr 16].
- Partnership for Carbon Transparency. Partnership for Carbon Transparency (PACT): World Business Council for Sustainable Development; 2024 [cited 2025 Apr 15]. Available from: URL: https://www.carbon-transparency.org/.
- Methane can also be produced through anaerobic decomposition, a much more potent greenhouse gas than CO2.
- World Business Council for Sustainable Development. Recommendations on Biomass Carbon Neutrality. Geneva, Switzerland: World Business Council for Sustainable Development; 2015 [cited 2025 Apr 23]. Available from: URL: https://www.wbcsd.org/wp-content/uploads/2024/08/FSG-Recommendations-on-Biomass-Carbon-Neutrality.pdf.
- BASF calculation of the carbon footprints of its Home Care and Personal Care products. Assumption: the entire carbon content of the product is converted to CO2 and emitted.
- Seelig B, Schoeneboom J. Product Carbon Footprint: A Key to Effective Sustainability Strategies. SOFW Journal 2023 [cited 2024]; 149(12):12–7. Available from: URL: https://www.sofw.com/en/sofw-journal/articles-en/48-personal-care/4312-product-carbon-footprint-a-key-to-effective-sustainability-strategies.
- Schmidt J, Rosa M de. Certified palm oil reduces greenhouse gas emissions compared to non-certified. Journal of Cleaner Production 2020; 277:124045.
- BASF. BASF partners with Acies Bio to drive sustainable production of Personal and Home Care ingredients. Ludwigshafen, Germany, Ljubljana, Slovenia; 2024 [cited 2024 Nov 5]. Available from: URL: https://www.basf.com/global/en/media/news-releases/2024/11/p-24-313.
- BASF SE. BASF Report 2024. Ludwigshafen, Germany; 2024 [cited 2025 Apr 15]. Available from: URL: https://report.basf.com/2024/en/_assets/downloads/entire-full-report-basf-ar24.pdf?h=bgn5lq-I.
- Harrandt J, Carus M, vom Berg C. Evaluation of Recent Reports on the Future of a Net-Zero Chemical Industry in 2050. Renewable Carbon Initiative; 2024. Available from: URL: https://pieweb.plasteurope.com/members/pdf/P256688b.PDF.
- BASF. BASF Verbund; 2024 [cited 2025 Apr 16]. Available from: URL: https://www.basf.com/global/en/investors/calendar-and-publications/factbook/basf-group/verbund#content–871061766-746160708.
- BASF SE. Ludwigshafen site 2023 in figures. Available from: URL: https://www.basf.com/dam/jcr:33dc8962-f053-3ba9-9d5f-5d60aa461e9f/basf/www/global/de/documents/Ludwigshafen/standort-in-zahlen-2022/2024/Standort_LU_in_Zahlen_2023_EN.pdf.
- Krkljuš I, Saling P, Krüger C. Perspective Chapter: The Growing Importance of Bio-Attributed Products in Reducing Greenhouse Gas Emissions. In: Biomass Based Products.
- For example, certification systems by ISCCplus, REDCert2, RSB.
- TÜV Austria. OK renewable Certification Scheme OK 30 [cited 2025 Apr 16]. Available from: URL: https://okcert.tuvaustria.com/wp-content/uploads/sites/76/2025/04/PD-BA-TABE-CERT-REN-CS-030_OKRC_EN.pdf.
- International Organization for Standardization. ISO/WD 14077: Environmental management — Life cycle assessment — Requirements and guidelines for application of Chain of Custody (CoC) approaches in Life Cycle Assessment (LCA): under development. Geneva, Switzerland: International Organization for Standardization. Available from: URL: https://www.iso.org/standard/61120.html#lifecycle.

Precision Fermentation Meets AI: Transforming Personal Care Ingredient...

Exploring Hybrid Beauty: from the origins to the latest trends and reg...
Skinimalism, Hybrid Beauty and What Consumers Really Want

Soothing and Protective effects of a mixture of Saccharide Isomeratem...

The complexity of sunscreens

Patents for Chemists: A Practical Guide to Innovation Protection
EUDR – Europe’s Dumbest Regulation

The unique multifunctionality of polyglyceryl esters: The science, sus...